aframe-playground
A playground for learning about A-frame
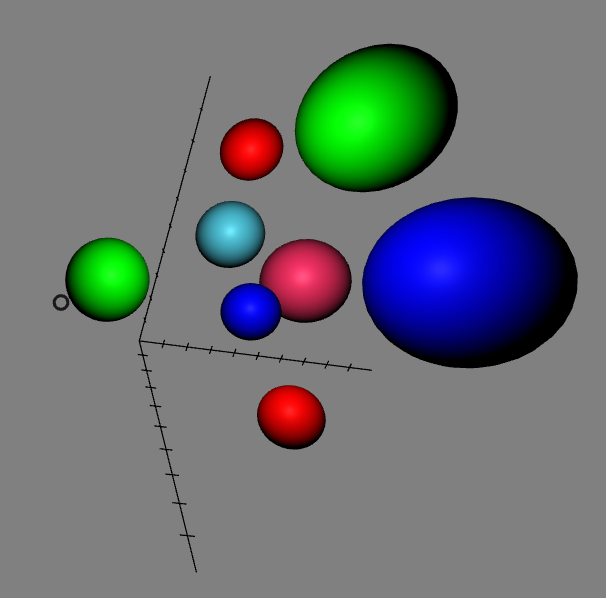
Visualizing data
Now, I’m going to work in data-01,
visualizing some data points with a scatterplot
(each dot will be an sphere).
What’s in the code
The relevant code is now in data.js
The code starts by defining a variable, items, which is an array of
the data points to visualize. For each data point we have three coordinates,
a size, and a color:
var items = [
    {x: 2, y: 8, z: 0, size: 1, color: "#ff0000"},
    ...
    {x: 2, y: 10, z: 6, size: 1.5, color: "#00ff00"}
];
Then, there is a function, plotAxis to plot the X, Y and Z axis, including
ticks every unit. For it, we use line A-Frame components.
For example, for creating the X axis, we just add a line to the
axis element, and then in a loop, we again use lines to
display ten ticks:
axis.setAttribute('line__x', {'start': {x: 0, y: 0, z: 0},
                           'end': {x: 10, y: 0, z: 0},
                           'color': color});
for (var tick = 1; tick < 10; tick++) {
  axis.setAttribute('line__x' + tick, {'start': {x: tick, y: -0.2, z: 0},
                             'end': {x: tick, y: 0.2, z: 0},
                             'color': color});
};
After that, there is another function, plotDot to plot a data point.
It just creates a sphere, adds the attributes to position it according
to the intended coordinates, and adds a even listener to make it larger
when the pointer is over it:
function plotDot (scene, position, size, color) {
  var sphere = document.createElement('a-sphere');
  sphere.setAttribute('radius', size);
  sphere.setAttribute('position', position);
  sphere.setAttribute('color', color);
  sphere.addEventListener('mouseenter', function () {
    sphere.setAttribute('scale', {x: 1.3, y: 1.3, z: 1.3});
  });
  ...
  scene.appendChild(sphere);
};
Finally, we have some code that is triggered when the DOM is composed, and adds the axis and the data points, using the above functions.
So, not a big deal, little new from A-Frame here: this exercise is just using what we already know to produce a simple data points visualization.
Generating dist files and running everything
As we saw in the previous section, the complete process to build the project is:
$ cd data-01
$ npm install
$ npm run start
This will build everything, you will only need a browser to see the resulting scene.
Results
Check the resulting virtual reality scene.