aframe-playground
A playground for learning about A-frame
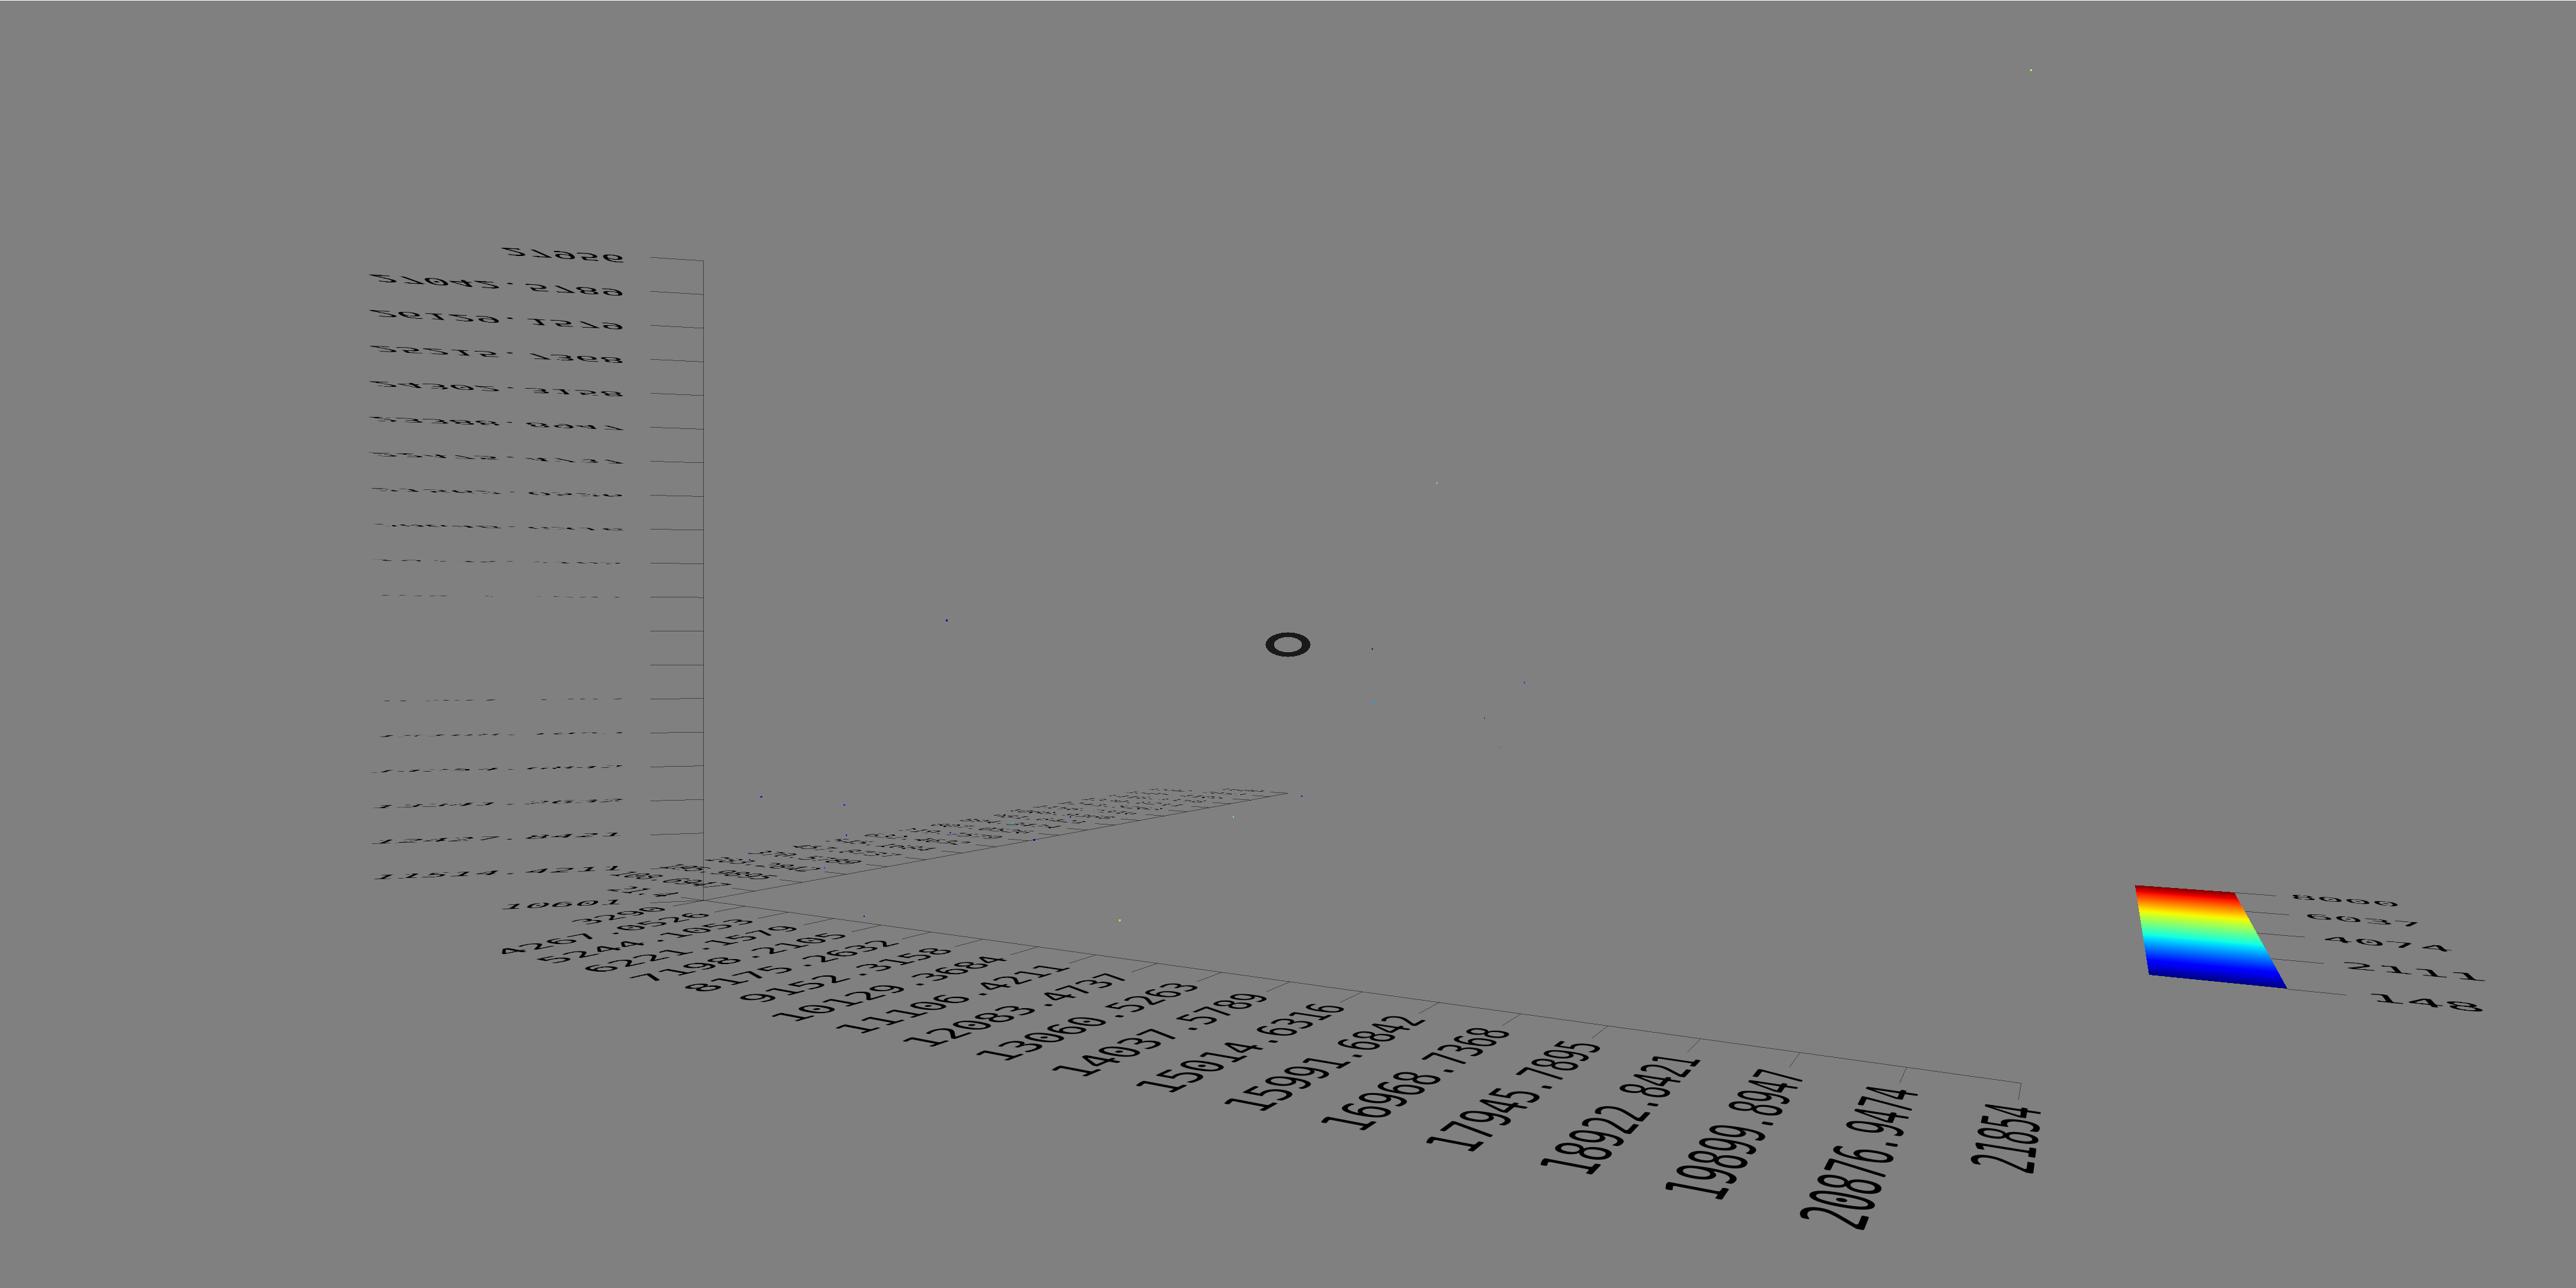
Some 3D plots
Once I’m happy with webpack configuration, let’s go back to A-frame. Focus. Focus! Focus!!
Did I say I need some focus?
I will work now on directory plots-01.
I’m going to play a bit with
aframe-scatterplot
I start with a copy of my templates directory, and in it:
npm install
npm install aframe-scatterplot --save
npm install d3 --save
And add the dependencies to src/main.js:
...
import * as d3 from 'd3';
window.d3 = d3;
import 'aframe-scatterplot';
...
The assignment to window.d3 is needed because aframe-scatterplot
seems to assume d3 is defined as a global object.
If it is not defined that way, aframe-scatterplot just doesn’t work.
Now, I get some data for defining a scatterplot: example dataset:
$ wget https://raw.githubusercontent.com/zcanter/aframe-scatterplot/master/example/sample-data/cities.json
I place it under src.
I need to incorporate it to the webpack configuration,
so in webpack.config.js I add a new loader for JSON files
(I’m going to use file-loader for now,
maybe I will try specific JSON loaders later):
// JSON files
  {
    test: /\.json$/,
    include: [path.resolve(__dirname, 'src')],
    exclude: fontFilesPattern,
    loader: 'file-loader',
    options: {
    name: '[name].[ext]'
    }
  },
I also add the dependency in main.js:
...
const cities = require('./cities.json')
...
And that’s it. Ready to add the magic to index.html,
so that I get a 3D scatterplot:
<a-scatterplot position="-0.5 1.2 -1.2" rotation="0 60 0"
  src="cities.json"
  x="Area" y="Pop 2000" z="Pop 1980" val="Vehicles">
</a-scatterplot>